Table of Contents
- Introduction to Modern API Monitoring
- Why Standard Logging Falls Short
- Understanding API Observability
- The Core Pillars of OpenTelemetry
- Architecting for Observability
- Instrumentation Best Practices
- Tracing Requests Across Microservices
- API performance monitoring Strategies
- OpenTelemetry API monitoring for Distributed Systems
- Common Challenges in Implementation
- Tooling and Backend Integration
- Best Practices for Data Collection
- API observability with OpenTelemetry for production
- Conclusion
Introduction to Modern API Monitoring
Modern distributed systems rely on complex webs of services communicating over networks. When an API call fails or slows down, finding the root cause becomes a daunting task for any engineering team.
Traditional monitoring tools often provide alerts but lack the deep context needed for resolution. This is where modern observability practices change the game for developers.
Why Standard Logging Falls Short
Logs provide a snapshot of an event at a single point in time. However, they struggle to convey the full lifecycle of a request as it moves through multiple internal services.
When you have dozens of microservices, stitching logs together to form a coherent story is physically impossible. You need a unified approach that connects the dots across your entire stack.
- Logs lack cross-service context
- Manual correlation is time-consuming
- Inconsistent formatting causes friction
Understanding API Observability
API observability represents the ability to understand your system's internal state based on its external outputs. Unlike monitoring, which tells you that a system is broken, observability helps you understand why it is broken.
It empowers developers to debug complex failures by looking at the entire journey of a request. This shift from reactive alerting to proactive understanding is essential for high-scale environments.
The Core Pillars of OpenTelemetry
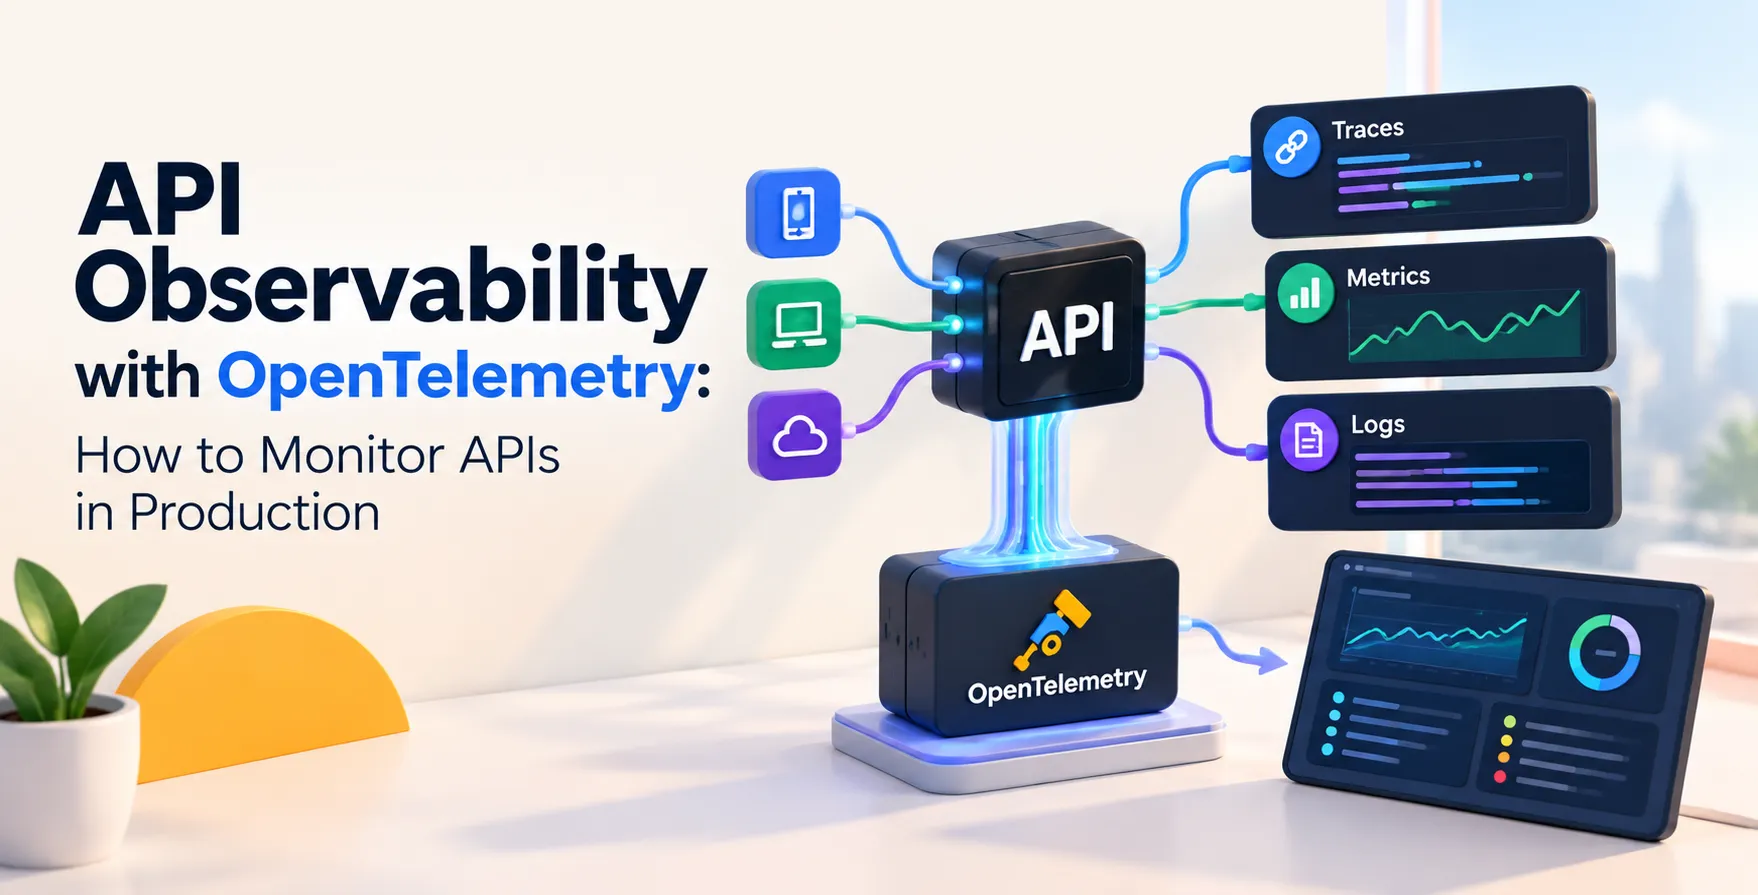
OpenTelemetry has become the industry standard for collecting telemetry data. It offers a vendor-neutral framework to capture traces, metrics, and logs in a unified manner.
Distributed Tracing
Tracing tracks the path of a request through your entire architecture. It records every hop, database query, and external call made during the transaction.
- Visualizes latency bottlenecks
- Identifies service dependencies
- Simplifies debugging complex flows
Metrics and Logs
Metrics provide quantitative data like request rates and error counts. Logs offer the granular detail needed for deep-dive investigation.
- Tracks system resource usage
- Captures specific error messages
- Aggregates performance data
Architecting for Observability
You must consider observability during the early stages of API design. If you wait until production to think about instrumentation, you will likely struggle with blind spots.
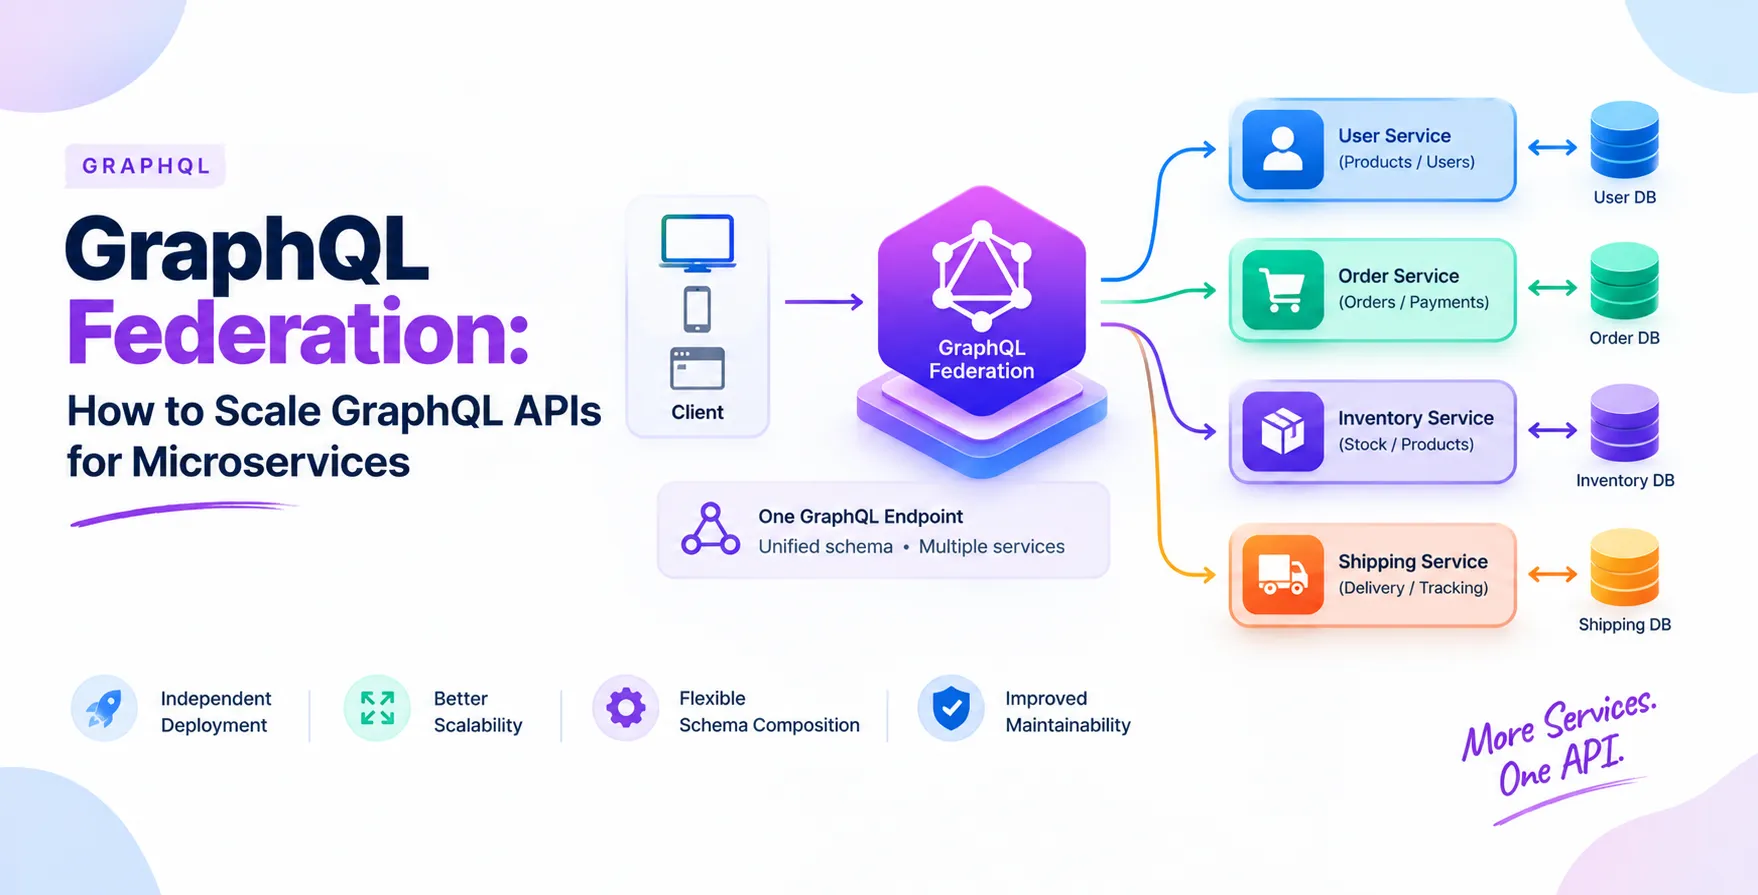
Whether you are building with REST, GraphQL, or gRPC, ensure your headers propagate trace contexts correctly. This propagation is the glue that keeps your trace spans linked across service boundaries.
Instrumentation Best Practices
Auto-instrumentation is a great starting point for most teams. Most language SDKs provide libraries that automatically capture common framework events without requiring significant code changes.
Manual Instrumentation
Sometimes auto-instrumentation is not enough for your unique business logic. Use the OpenTelemetry API to manually define spans for critical code paths.
- Wrap database transactions
- Identify specific business events
- Track custom business logic
Context Propagation
Context propagation ensures that the trace ID follows the request everywhere it goes. If this chain is broken, your trace data will appear as disconnected fragments.
- Use standardized header formats
- Inject ID into messages
- Extract ID upon receipt
Tracing Requests Across Microservices
Tracing is most powerful when it spans across service boundaries. You can see how a single user action triggers a cascade of calls throughout your infrastructure.
This visualization highlights where latency originates in your system. Often, the bottleneck is not the API endpoint itself but a downstream database query or a slow third-party integration.
API performance monitoring Strategies
API performance monitoring requires more than just tracking response times. You need to segment your performance data by endpoint, customer, or geographical region to understand user impact.
Look for latency outliers rather than just averages. Averages often hide the poor experience of users impacted by spikes in processing time.
- Analyze P99 latency metrics
- Track throughput for endpoints
- Monitor error rate trends
OpenTelemetry API monitoring for Distributed Systems
When you implement OpenTelemetry API monitoring, you gain insights into how your services interact under load. This is critical for identifying race conditions or connection pool exhaustion.
It also helps teams understand the impact of configuration changes on overall system health. You can compare trace patterns before and after a deployment to ensure stability.
Common Challenges in Implementation
Implementing observability is rarely seamless. Teams often face hurdles related to data volume, cost, and developer friction when introducing new telemetry practices.
- High data storage costs
- Performance overhead on services
- Inconsistent data schema
- Complexity of configuration
Tooling and Backend Integration
Once you have collected your data, you need a backend to store and visualize it. Many platforms now support the OpenTelemetry protocol natively, making integration straightforward.
Choose a backend that allows for flexible querying and powerful alerting. You want to be able to jump from a high-level dashboard down to an individual span in seconds.
Best Practices for Data Collection
Sampling is your best friend when managing telemetry costs. You do not need to record every single request if you have high traffic volume.
Implement head-based or tail-based sampling to keep the most relevant data. This ensures you capture enough information for debugging while keeping your storage costs under control.
- Use smart sampling strategies
- Define clear data retention policies
- Standardize naming conventions
- Regularly audit telemetry data
API observability with OpenTelemetry for production
Successful API observability with OpenTelemetry for production requires a shift in engineering culture. Developers must take ownership of the telemetry their services emit.
Treat your instrumentation like production code, not an afterthought. When everyone understands the value of deep visibility, the entire team becomes faster at resolving incidents and shipping stable updates.
Conclusion
Observability is a journey rather than a destination. By adopting OpenTelemetry, you equip your team with the tools to understand your APIs at a deep, granular level.
Start by instrumenting your most critical paths and expand from there. Over time, the insights you gain will transform how you build, maintain, and scale your software systems.


 In collaboration with